PREFORMULATION STUDIES
Preformulation testing involved investigation of physical and chemical properties of a drug substance alone and when combined with excipients. It was the first step in the rational development of dosage forms.
These studies are categorised as under:
1. API characterization
2. Drug-Excipient Compatibility study
API Characterization
These are preliminary characteristics of any substance which is useful in identification of specific material. Following physical properties of API were studied.
a) Colour
b) Odour
Table no. : Characterization of API
|
Test |
Observation |
|
Colour |
White |
|
Odour |
Odourless |
Sieve analysis:
The sieve analysis main concept is to know the different drug particles size in the sample. The standard sieves with larger pore size i.e., with less sieve number on the top position are placed one over the other and followed by sieves of decreasing pore size i.e., with larger sieve number towards the bottom.
Procedure:
% retained = Final weight – initial weight x 100
Total weight taken
Table no. : Particle size distribution of API
|
Sieve number |
Percentage of sample retained (%) |
Cumulative percentage of sample retained (%) |
|
40 |
3.0 |
3.0 |
|
60 |
19.2 |
22.2 |
|
80 |
26.3 |
48.5 |
|
100 |
24.2 |
72.7 |
|
140 |
8.1 |
80.8 |
|
200 |
19.2 |
100.0 |
The solubility studies for the drug were carried out using the orbital shaker. Solubility of the drug across different buffers was studied. The pH ranged from 1.2 to 6.8 (1.2 , 4.5, 6.8, and water). All the buffers were prepared according to USP 34 NF 29, 2011. Excess drug was added to 100 ml of water in stoppered conical flasks and were agitated continuously in a orbital shaker for 24 hrs at 200 rpm and room temperature (25° C), till saturation was observed. Then, the samples were filtered using 0.45 µ Nylon (47 mm) syringe filters. Now the filtered samples were analyzed using UV spectrophotometer Table No.6.3 below describes the procedure of buffers preparation.
Table 6.5 preparation of buffers
|
Buffer |
Procedure |
|
PH 1.2 buffer |
8.5 ml of Conc. HCL was added to 1000 mL volumetric flask. Then it was diluted and made up to volume with water |
|
PH 4.5 phosphate buffer |
13.61 gm of KH2PO4 was added to 1000 mlvolumetric flask. Then it was made up to volumewith water |
|
PH 6.8 phosphate buffer |
250 mL of 0.2 M monobasic potassium phosphate solution was taken in a 1000 mL volumetric flask. Then 112 mL 0.2M Sodium hydroxide solution was added to it and water was added to make up to the volume |
Table7.3 Solubility of API in buffers of different pHs
|
PH |
Solubility(mg/ml) |
|
1.2 |
42.36 |
|
4.5 |
44.96 |
|
6.8 |
0.80 |
|
Water |
0.674 |
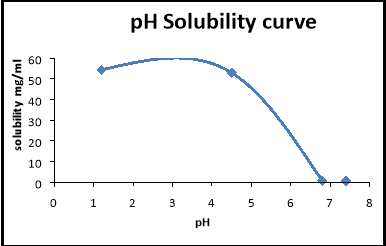
Fig 7.1 pH Solubility curve of API
Drug excipient compatibility study
There is always possibility of Drug – excipient interaction in any formulation due to their intimate contact. It is also necessary to determine any possible interaction between excipients used in the formulation. This will also indicate success of stability studies.
Method: Physical observation
Condition: 40 ±2 o C and 75 ± 5% RH
Procedure:
|
S.No |
EXCIPIENTS |
DRUG: EXCIPIENT RATIO |
|
1 |
Polyethyleneoxide |
1:1 |
|
2 |
HPMCK100M |
1:1 |
|
3 |
MCC |
1:1 |
|
4 |
Cellulose acetate |
1:1 |
|
5 |
Sodiumchloride |
1:1 |
|
6 |
Citric acid |
1:1 |
|
7 |
Sodium lauryl sulphate |
1:1 |
|
8 |
Magnesium stearate |
1:1 |
|
9 |
Talc |
1:1 |
Table 7.4 Results of Drug-Excipient compatibility at 25oC/60% RH
|
S.no: |
Excipent |
Colour change |
Lumps |
Caking |
|||
|
O |
C |
O |
C |
O |
C |
||
|
1 |
Polyethylene oxide |
X |
X |
X |
X |
X |
X |
|
2 |
HPMC |
X |
X |
X |
X |
X |
X |
|
3 |
MCC |
X |
X |
X |
X |
X |
X |
|
4 |
Cellulose acetate |
X |
X |
X |
X |
X |
X |
|
5 |
Sodium chloride |
X |
X |
Lumps observed |
X |
X |
X |
|
6 |
Citric acid |
X |
X |
Lumps observed |
X |
X |
X |
|
7 |
Sodium lauryl sulphate |
X |
X |
Lumps observed |
X |
X |
X |
|
7 |
Magnesium stearate |
X |
X |
X |
X |
X |
X |
|
8 |
Talc |
X |
X |
X |
X |
X |
X |
Note: x – indicates no change, O- open condition ,C- close condition
Table 7.5 Results of Drug-Excipient compatibility at 40oC / 75% RH
|
S.no: |
Excipient |
Colour change |
Lumps |
Caking |
|||
|
O |
C |
O |
C |
O |
C |
||
|
1 |
Poly ethylene oxide |
X |
X |
X |
X |
X |
X |
|
2 |
HPMC |
X |
X |
X |
X |
X |
X |
|
3 |
MCC |
X |
X |
X |
X |
X |
X |
|
4 |
Cellulose acetate |
X |
X |
X |
X |
X |
X |
|
5 |
Sodium chloride |
X |
X |
X |
X |
Caking observed |
X |
|
6 |
Citric acid |
X |
X |
X |
X |
Caking Observed |
X |
|
7 |
Sodium lauryl sulphate |
X |
X |
X |
X |
Caking observed |
X |
|
8 |
Magnesium stearate |
X |
X |
X |
X |
X |
X |
|
9 |
Talc |
X |
X |
X |
X |
X |
X |
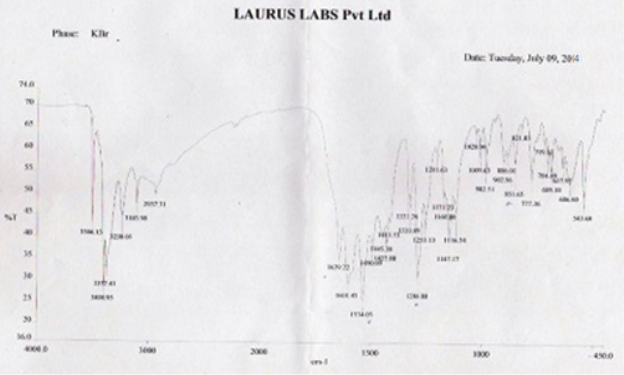
FTIR study:
FTIR studies were carried out for pure drug alone and blend of drug & excepients. The FTIR spectroscopy (BRUKER Optics FTIR spectrophotometer) is employed as analytical tool to check the drug-excepients interaction, using the KBr disc method. The FTIR spectra were scanned and recorded between 400 and 4000 cm-1
Method:
Nearly to a fine alkali halide (example KBr) powder of 200 to 250 mg 0.1 to 1.0 % sample is mixed well. Later it is pulverized and in a pellet-forming die it is placed. Around an 8 tons force under a vacuum of several mm Hg is applied to form transparent pellets.
FTIR spectroscopy of pure drug of Famotidine
|
S.no |
Type of vibration |
Actual frequency (cm-1) |
Observed frequency (cm-1) |
Confirmation |
Table no. : Interpretation of FTIR spectra of pure famotidine
FTIR spectroscopy of drug and excipient blends
Table 7.6 Peaks of FTIR study
|
Peaks ( cm –1) |
Functional groups |
|
3506.13 |
–OH |
|
3377.41-3400.95 |
–NH2 |
|
3238.03 |
-NH |
|
1445.38- 1639.22 |
C=N |
|
689.10 -606.6 |
C-S |
|
1320.81 |
S(=O) 2 asymmetric stretching |
|
1147.17 |
S(=O) 2 symmetric stretching |
Table no. : Interpretation of FTIR spectra of pure famotidine
|
S.no |
Type of vibration |
Actual frequency (cm-1) |
Observed frequency (cm-1) |
Confirmation |
ANALYTICAL METHOD
ESTIMATION OF FAMOTIDINE:
A solution of Famotidine was prepared in 0.1 N HCl and Phosphate buffer pH 4.5and 6.8 UV spectrum was taken using Perkin Elmer UV/Vis double beam spectrophotometer.The UV maxima of Famotidine was found to be 265 nm in both 0.1N HCl & pH 4.5. In pH 6.8 it was found to be 268 nm
100 mg Famotidine each was dissolved in 0.1 N HCl and pH 4.5 buffer and volume is made up to 100 with respective buffer. 10 mL of stock solution (1mg/ml) was further diluted upto 100 ml with respective buffer to obtained solution of 100 µg/mL.Now from stock 2 further dilutions were done with respective buffer to obtain solutions of 2, 5, 10, 15, 20 and 25 µg/ml Absorbance of each solution was measured at 265 nm using Perkin Elmer UV/Vis double beam Spectrophotometer.
10 mg Famotidine each was dissolved in pH 6.8 phosphate buffer and volume is made
up to 100 ml to obtain solution of 100 µg/ml. Now from this stock solution further dilutions were done with PH 6.8 to obtain solutions of 10 , 20 , 30 and 40 µg/ml Absorbance of each solution was measured at 268 nm using Perkin Elmer UV/Vis double beam Spectrophotometer.
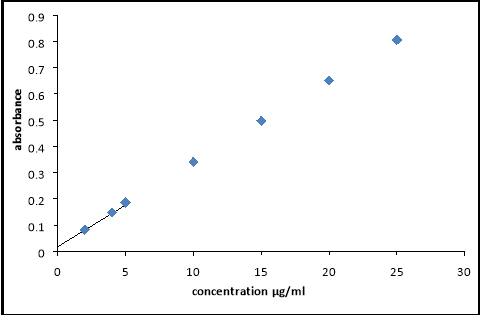
The experiment was performed in triplicate and based on average absorbance; the equation for the best line was generated. The results of standard curve prepared in pH 1.2, 4.5 & 6.8 were shown below
Table 7.7 Standard curve of API in PH 1.2 , 4.5 & 6.8 buffers
|
Concentration |
Absorbance in pH 1.2 |
Absorbance in pH 4.5 |
Absorbance in pH 6.8 |
|
2 |
0.085 |
0.082 |
– |
|
4 |
0.141 |
0.148 |
– |
|
5 |
0.189 |
0.186 |
– |
|
10 |
0.333 |
0.341 |
0.251 |
|
15 |
0.510 |
0.497 |
– |
|
20 |
0.701 |
0.651 |
0.467 |
|
25 |
0.852 |
0.806 |
– |
|
30 |
– |
– |
0.746 |
|
40 |
– |
– |
0.989 |
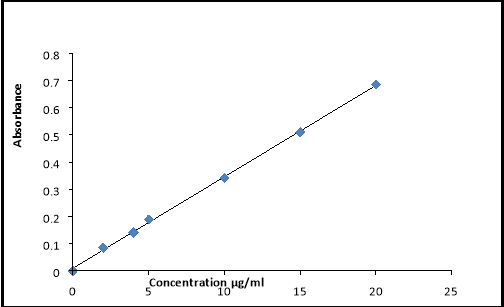
FIG 7.4 standard curve at PH 1.2 Buffer
|
|
Fig 7.5 standard curve at PH 4.5 Buffer
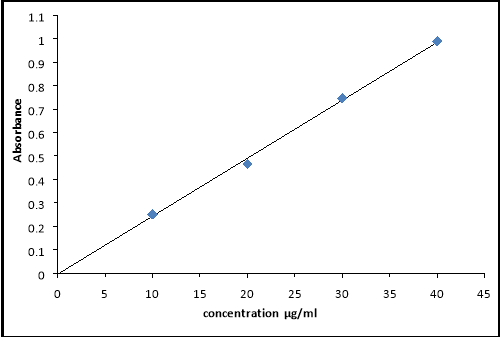
Fig 7.6 standard curve at PH 6.8 Buffer
Calculation of initial dose and maintenance dose for the design of elementary osmotic pump of famotidine for 12 hours:
There are no sustained release formulations for famotidine in the market, hence the total dose (DT) consisting of initial (DI) and maintenance doses (DM) for formulating the famotidine sustained release was calculated as per Robinson and Eriksen equation with a zero order release principle36 . In this profile the rate of delivery is independent of the amount of drug remaining in the dosage form and constant over time as shown by the Eq. 6.1
Drug availability rate k0 = Rate in = Rate out Eq. 6.1
Where, k0 is the zero order rate constant for drug release (amount per time).
DI is required to give initial rapid release of drug so as to attain the minimum therapeutic level immediately after dosing.
 Inital dose (DI) = CSSAVG Vd Eq. 6.2
F
Where, C ssavg is the average steady state plasma level, V d is the volume of distribution and F is the fraction of dose absorbed.
k0 = DIKel Eq. 6.3
Where, Kel is overall first order drug elimination rate constant (per hour). Hence k 0 should be equal to the elimination rate constant so as to maintain the steady state condition.
In general the total dose required (D T) is the sum of maintenance dose (DM) and the initial dose (DI)
DT = D I + D M Eq. 6.4
In practice, D M (mg) is released over a period of time and is equal to the product of H (the number of hours for which sustained action is desired after initial dose) and the zero order rate constant, k0 (mg/hr).
Therefore the Eq. 6.4 can be expressed as
DT = D I + k0H Eq. 6.5
Ideally the maintenance dose (DM) is released after DI has produced a minimum therapeutic blood level of the drug. However due to the limits of formulations, drug release even starts from DM also from the beginning i.e. at t=0, thus increasing the initial drug level in the blood. Hence it is necessary to reduce the initial dose of the drug to account for the excess release for drug from DM by using a correction factor, k0tp. This correction factor is the amount of drug provided by DM during the period from t=0 to the time of the peak drug level, tp. The corrected initial dose (DI*) becomes DI-(k0tp). Then the total dose is
DT = DI* + k0H = (D I – k0tp) + k0H Eq. 6.6
Elimination half life (t1/2) of famotidine is 3 hrs (average of 2.5 to 3.5 hrs), the time to reach peak plasma (t p) is 3 hrs and Vd = 80.5 L and F = 0.4 54,55 . From the literature of the PEPCID (innovator product of famotidine in USA) label and pharmacological review information 49,, it was found that the plasma levels after multiple doses are similar to those after single doses indicating the C max is similar to Cssavg , therefore Cmax of 0.07 mg/L was taken as C ssavg .
The initial dose (DI), corrected initial dose (DI*), maintenance dose (DM) and total dose (DT) were calculated according to calculations described above.
Elimination rate constant (K el ) = 0.693/t 1/2
= 0.693/3 = 0.231 hr -1
Inital dose (DI) = CSSAVG Vd Eq. 6.2
F = (0.07 X 80.5)/0.4
= 14.0875 mg
Desired input rate from maintenance dose (k 0) = DIKel
= 14.0875 X 0.231 = 3.25 mg/hr
Maintenance dose (DM) = k0H (Since, H = the number of hours for which sustained action is desired after initial dose = (12-1) = 11 hrs)
= 3.25 X 11 = 35.796 mg
DI* = DI – (k0tp)
= 14.087 – (3.25 X 3 ) = 4.93 mg
Total dose (D T) = D I* + D M
= 4.93 + 35.796 = 40.726 mg
From the above calculations the total dose obtained for sustained release of famotidine for 12 hrs is 40.726 mg. The total dose was rounded off to 40mg for the convenience. Initially the dosage form should release the total initial dose (i.e. 4.93 mg ~ 5.0 of drug, means 11% of total 50 mg dose) in the first 1 hr followed by maintenance dose (i.e. 40-5=35 mg of drug) for up to 12 hrs there after at a release rate of 3.25 mg/hr (i.e. 8.125% of total 40 mg dose). Based on these assumptions the theoretical release profile was predicted and shown
Table 6.7 Predicted theoretical release profile
|
Time (hrs) |
% CDD |
|
1 |
11.4 |
|
2 |
19.425 |
|
3 |
27.45 |
|
4 |
35.475 |
|
5 |
43.5 |
|
6 |
51.525 |
|
7 |
59.55 |
|
8 |
67.575 |
|
10 |
83.625 |
|
12 |
99.675 |
JNTUA-OTRI, Ananthapuramu 1
Delivering a high-quality product at a reasonable price is not enough anymore.
That’s why we have developed 5 beneficial guarantees that will make your experience with our service enjoyable, easy, and safe.
You have to be 100% sure of the quality of your product to give a money-back guarantee. This describes us perfectly. Make sure that this guarantee is totally transparent.
Read moreEach paper is composed from scratch, according to your instructions. It is then checked by our plagiarism-detection software. There is no gap where plagiarism could squeeze in.
Read moreThanks to our free revisions, there is no way for you to be unsatisfied. We will work on your paper until you are completely happy with the result.
Read moreYour email is safe, as we store it according to international data protection rules. Your bank details are secure, as we use only reliable payment systems.
Read moreBy sending us your money, you buy the service we provide. Check out our terms and conditions if you prefer business talks to be laid out in official language.
Read more