Graphically show and explain the following terms, how you could link them to capital budgeting techniques in your decision making (1000 words)
Sensitivity analysis is a ‘what if’ tool that examines the effect of increase or decrease in a company’s net profit. Sensitivity analysis can help in answering question like ‘What would be the forecasted net income if sales are increased or decreased by 30%, 20% or 10%.
Sensitivity analysis is frequently used in capital budgeting for determining how sensitive an NPV analysis is to changes in variable assumptions. While conducting analysis, each variable is fixed except one and by changing this one variable, the effect on NPV or IRR can be viewed.
The first step in performing a sensitivity analysis is building a base case scenario. This is typically the NPV using assumptions which are believed to be accurate. From this point various assumptions can be changed which had initially been based on potential assumptions. NPV is then recalculated and the sensitivity of NPV based on the change in assumptions is determined.
Scenario analysis is a process of analysing decisions by considering alternative possible outcomes. Scenario analysis is designed to see the consequences of an action under different set of factors.
Scenario analysis takes sensitivity analysis a step further. Rather than just looking at the sensitivity of the NPV analysis to changes in the variable assumptions, scenario analysis also looks at the probability distribution of the variables.
Like sensitivity analysis, scenario analysis starts with the construction of a base case scenario. From there other scenarios are considered known as the ‘best case’ and ‘worst case’ scenario. Probabilities are assigned to the scenarios and computed to arrive at an expected value.
Capital budgeting is the process of analysing a company’s investment decisions such as investing in new equipment, machineries, plants, projects and products. This process involves the estimation of the expected cash flows, the calculation of the Net Present Value (NPV) and the calculation of the Internal Rate of Return (IRR) of the investment. NPV is defined as the present value of all cash inflows minus the present value of all cash outflows. If NPV is positive, the investment is making money and is thus viable. IRR is defined as the discount rate that makes the NPV zero. If IRR is greater than the opportunity cost of capital then the investment is feasible.
There are two obstacles involved in the capital budgeting process. One involves the correct estimation of expected cash flow. The other is the use of correct discount rate also known as the project cost of capital.
Capital budgeting is by definition, forward looking. When dealing with expected resources and demands, uncertainty is a major factor. Sensitivity analysis is a statistical tool that determines how consequential deviations from the expected value occur.
XYZ Water Filtration Plant needs to construct a new water filtration plant to filter 20 million litre water and deliver to consumers. An assessment should be carried out to evaluate the economics of the project and determine which parameter is sensitive to investment value, also to establish a sales price. Market price of water is $4 – $5 per litre therefore, four different water price scenarios would need to be analysed to reach the best economic parameter, they are: $4, $4.25, $4.5 and $4.75.
The selection criteria would be based on:
Table 1: Project Information
|
Water filtration plant cost |
$32,750,000 |
AUD |
|
Water price (assumption) |
$4.5 |
AUD/Litre |
|
Water production |
20 |
Million Litre |
|
Revenue |
$90,000 |
per day |
|
$32,850,000 |
per year |
|
|
Operating cost |
$1 |
per litre |
|
$7,300,000 |
per year |
|
|
Plant lifetime |
15 |
year |
|
Cost of capital |
15% |
Table 2: Baseline Cash flow calculation
Baseline cash flow and NPV are calculated as follows:
|
Year |
Revenue |
Capital Investment |
Operational Cost |
Depreciation |
Equity to be split |
Government take |
Cash Flow |
NPV |
|
0 |
(32,750,000) |
(32,750,000) |
6,334,796 |
|||||
|
1-15 |
34,675,000 |
(7,300,000) |
(2,183,333) |
29,558,333 |
(20,690,833) |
6,684,167 |
Table 3: Sensitivity Analysis Calculation
In sensitivity analysis, each variable is changed one at a time to analyse its impact on the end result. In this case the impact of 10% increase or decrease in revenue, capital investment and operational cost is considered on the NPV.
|
Increase/ Decrease |
Year |
Revenue |
Capital Investment |
Operational Cost |
Cash Flow |
NPV @15% |
|
|
Revenue |
10% |
0 |
– |
(32,750,000) |
– |
(32,750,000) |
8,895,944 |
|
1-15 |
36,135,000 |
– |
(7,300,000) |
7,122,167 |
|||
|
-10% |
0 |
– |
(32,750,000) |
– |
(32,750,000) |
(2,629,222) |
|
|
1-15 |
29,565,000 |
– |
(7,300,000) |
5,151,167 |
|||
|
CAPEX |
10% |
0 |
– |
(36,025,000) |
– |
(36,025,000) |
(1,035,312) |
|
1-15 |
32,850,000 |
(7,300,000) |
5,983,833 |
||||
|
-10% |
0 |
– |
(29,475,000) |
– |
(29,475,000) |
7,302,034 |
|
|
1-15 |
32,850,000 |
– |
(7,300,000) |
6,289,500 |
|||
|
OPEX |
10% |
0 |
– |
(32,750,000) |
– |
(32,750,000) |
1,852,787 |
|
1-15 |
32,850,000 |
– |
(8,030,000) |
5,917,667 |
|||
|
-10% |
0 |
– |
(32,750,000) |
– |
(32,750,000) |
4,413,935 |
|
|
1-15 |
32,850,000 |
– |
(6,570,000) |
6,355,667 |
From table 3, a sensitivity graph can be plotted as follows:
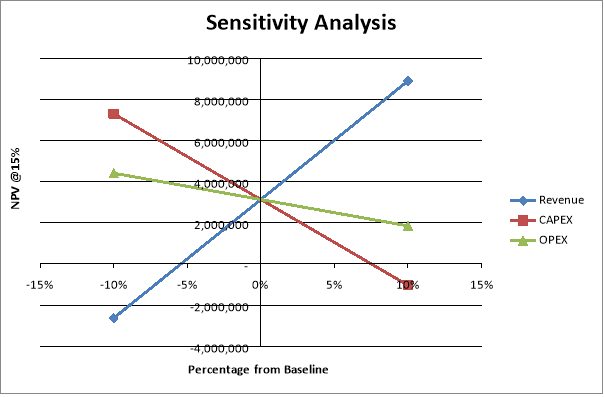
Based on above sensitivity analysis, it is evident that the revenue by terms of price is the main variable that is affecting NPV. Hence the economic optimization and evaluation will be based on parameter water price. Using formula in the spreadsheet, following can be obtained:
Table 4: Water Sales Price Scenario
|
Water Price |
NPV |
IRR |
Payout Time |
|
$4.00 |
(3,269,509) |
12.90% |
6.5 |
|
$4.25 |
(68,074) |
14.96% |
5.9 |
|
$4.50 |
3,133,361 |
16.95% |
5.3 |
|
$4.75 |
6,334,796 |
18.89% |
4.9 |
Selection of preferred alternative
From table 4, we can conclude that best scenario is at water price $4.74 per litre, refer to criteria NPV, IRR and Payout Time. Then the project is worth doing, with the water price $4.75 per litre resulting NPV>0, IRR>MARR and payout time less than five years.
Sensitivity and scenario analysis in useful in capital budgeting techniques for a number of reasons, including:
SOURCE
Source: Boundless. “Scenario Analysis.” Boundless Finance. Boundless, 03 Jul. 2014. Retrieved 27 Apr. 2015 from https://www.boundless.com/finance/textbooks/boundless-finance-textbook/the-role-of-risk-in-capital-budgeting-12/scenario-and-simulation-assessments-99/scenario-analysis-427-7232/
Delivering a high-quality product at a reasonable price is not enough anymore.
That’s why we have developed 5 beneficial guarantees that will make your experience with our service enjoyable, easy, and safe.
You have to be 100% sure of the quality of your product to give a money-back guarantee. This describes us perfectly. Make sure that this guarantee is totally transparent.
Read moreEach paper is composed from scratch, according to your instructions. It is then checked by our plagiarism-detection software. There is no gap where plagiarism could squeeze in.
Read moreThanks to our free revisions, there is no way for you to be unsatisfied. We will work on your paper until you are completely happy with the result.
Read moreYour email is safe, as we store it according to international data protection rules. Your bank details are secure, as we use only reliable payment systems.
Read moreBy sending us your money, you buy the service we provide. Check out our terms and conditions if you prefer business talks to be laid out in official language.
Read more